

The Social Security Administration publishes a table the life insurance industry prices from and almost never shows you. In the 2023 period life table, the version used in the 2026 Trustees Report, 84,544 men out of an original 100,000 are still alive at exact age 60. At age 80, that number is 50,785.
Divide the second figure by the first. About 60 percent of men who reach 60 are still alive at 80. Run the same arithmetic for women, 64,606 divided by 91,080, and the answer is about 71 percent.
Now hold those two numbers against the product most often pitched to someone at 60: a 20-year term policy. It ends at 80. Most people who buy one are still alive when it expires, which means most of those policies pay nothing to anyone.
Buy one anyway if the need is real. Just size it knowing you are buying the minority case, because that is what the premium is priced against. Everything below follows from that one calculation.
I spent 18 years on the industry side of insurance and lead generation. I know what these leads cost, how they get scored, and which product a call center would rather put in front of you. This is the version I would hand my own family.
What the federal life table actually says
Two columns matter. Life expectancy is the average number of years remaining at an exact age. Number of lives is how many of an original 100,000 births are still alive at that age. The second column is the more useful one, and it answers the only question a term length is really asking.
How to read the table below. Find the age you would buy at, then find the age the policy would end. Divide the lives at the ending age by the lives at the starting age. That fraction is the share of people who are still alive when the term runs out, which is the share of policies that expire without paying. Worked examples follow the table.
| Exact age | Years remaining, men | Years remaining, women | Alive per 100,000, men | Alive per 100,000, women |
|---|---|---|---|---|
| 50 | 29.90 | 33.45 | 91,126 | 95,269 |
| 55 | 25.73 | 29.01 | 88,436 | 93,577 |
| 60 | 21.79 | 24.73 | 84,544 | 91,080 |
| 65 | 18.12 | 20.66 | 79,084 | 87,399 |
| 70 | 14.66 | 16.76 | 71,916 | 82,374 |
| 75 | 11.42 | 13.10 | 62,797 | 75,248 |
| 80 | 8.50 | 9.82 | 50,785 | 64,606 |
| 85 | 6.04 | 7.02 | 35,529 | 49,469 |
Source: Social Security Administration, period life table for 2023 as used in the 2026 Trustees Report, page certified May 28, 2026.
A 20-year term bought at 55 runs to 75: 62,797 divided by 88,436 is 71 percent for men, and 75,248 divided by 93,577 is 80 percent for women. A 20-year term bought at 65 runs to 85, where the same division gives 45 percent for men and 57 percent for women.
Read that last pair again. The 65-year-old buying 20-year term is the first case in this table where the policy is more likely than not to pay out for men, and the premium at that age reflects it.
Renting a promise versus buying one
Term life is a lease. You rent the insurer’s promise for a fixed number of years at a fixed price, and on the last day you hand it back with nothing to show for it, the same way a car lease ends. Permanent insurance is the purchase version. It costs several times more per month because part of the payment buys the promise and part goes into an account the insurer holds and credits interest on.
The expensive error is buying the purchase version when the situation called for a lease with an end date, then discovering in year eight that the payment no longer fits the household.
What the industry’s own filings show
Every licensed life insurer files an annual statement with state regulators, and the National Association of Insurance Commissioners aggregates them. The 2025 results, published in 2026 from filings by 727 companies, are the closest thing to an honest scoreboard this industry produces, because the numbers are filed for solvency regulation rather than marketing.
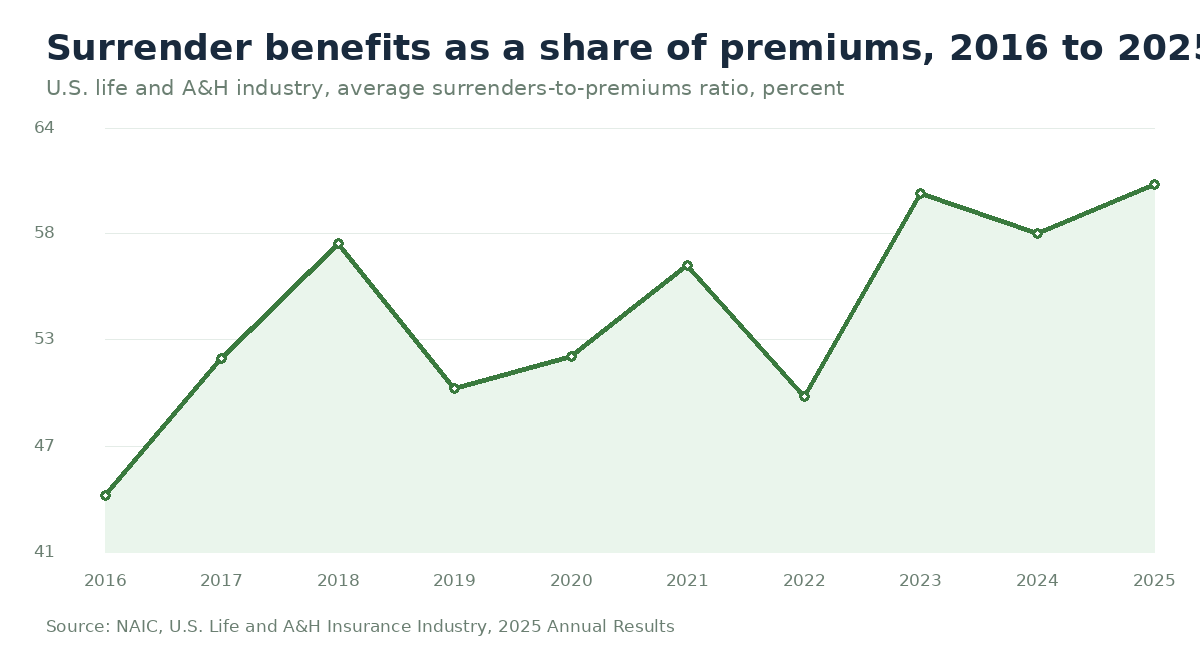
First, surrenders. Surrender benefits and withdrawals on life contracts totaled $487.6 billion in 2025, up $3.1 billion from 2024. The NAIC’s own average surrenders-to-premiums ratio reached 61.1 percent, its highest level in the ten years the report charts, against 58.4 percent in 2024 and 43.9 percent in 2016. One honest caveat: that line covers life contracts broadly, including annuity and deposit-type activity, so it is not a headcount of life insurance policyholders cashing out. What it does establish is the scale of money leaving these contracts early rather than paying a death benefit.
Second, where the industry earns. Of $36.8 billion in operating gain reported across the entire life insurance line in 2025, whole life alone accounted for $23.4 billion. Term life accounted for $10.2 billion. Whole life carried $69.8 billion of net premium against term’s $40.4 billion.
Dividing gain by premium gives roughly 34 percent for whole life and 25 percent for term. That looks like a margin comparison and it is a poor one, since a whole life book sits on decades of accumulated reserves throwing off investment income while a term book does not. The defensible version is narrower and still tells you what you need: whole life is the single largest source of operating gain in the entire life insurance line, roughly 64 percent of it, on well under half the line’s premium.
You do not need a conspiracy to explain a sales pitch after that. Products that generate the most gain get the most distribution, and distribution is where a shopper meets the industry.
One more line from the same table, for anyone who already owns a universal life policy. Universal life with secondary guarantees posted the largest operating loss in the life insurance line in 2025, at $1.8 billion. A block of business losing money is a block under pressure, and cost-of-insurance charges on in-force universal life policies can rise within contractual limits. If you own one, request an in-force illustration from your insurer in writing and read what it projects at the guaranteed rates rather than the current ones. In states that have adopted the NAIC’s Life Insurance Illustrations Model Regulation, Model #582, a policy owner may request that update once the policy has passed its first anniversary.
Four products, four different promises
Term. A promise for a set number of years. No account, no cash value, no residual. When the term ends the coverage ends, and any renewal is priced at the age you are then rather than the age you were. The renewal price is the part that surprises people, and it is disclosed in the contract from day one.
Whole life. A promise that does not expire, with a level premium and an account that accumulates. The premium is set high enough in the early years to fund the later ones, which is why the first several years of cash value are typically far less than what was paid in. That gap is where the sales commission lives.
Universal life, including indexed. A permanent policy with a flexible premium, which sounds like an advantage and functions as a responsibility. The insurer deducts cost-of-insurance charges from the account each month, and those charges rise as the insured ages. If crediting comes in below what the original illustration assumed, the account can drain and the policy can require additional premium to stay in force. Ask for the guaranteed-rate column, not the illustrated one.
Guaranteed issue and final expense. Small permanent policies sold without underwriting, aimed at burial and end-of-life costs. The trade for skipping the health questions is a limited benefit in the early policy years. That clause varies by contract and by state, and it is the first thing to read in the brochure.
Notice what is missing from those four paragraphs: prices. That is deliberate. No federal agency publishes a life insurance premium index the way it does for motor vehicle insurance, and the national rate figures circulating online come almost entirely from marketplaces paid a commission when you request a quote. Your own quotes, on identical coverage from several carriers, are better data than any average.
Where permanent coverage earns its price
Consumer writers tend to dismiss permanent insurance and leave it there. That is lazy, and it fails the households where it is the correct tool.
Permanent coverage earns its place when the need genuinely never ends. A dependent with a lifelong disability does not stop needing support at 80. A family business or a farm that cannot be split without being sold may need cash at the moment of death to keep the heirs from a forced sale. A pension elected as single life, with no survivor continuation, leaves a hole that arrives on a date nobody chooses. In each case the need has no expiration, so a product with an expiration is the wrong shape.
The tax treatment is also real and is often stated badly. Under Internal Revenue Code section 101(a), amounts received under a life insurance contract paid by reason of the insured’s death are generally excluded from the beneficiary’s gross income. That is a statutory fact, not a projection. It applies to term policies too, which is the part the pitch tends to leave out when the tax angle is used to sell permanent coverage specifically.
What to do next
Start with what you already have
Nobody earns a commission telling you that you are already covered, which is why this section does not appear in the material a carrier sends you.
Before pricing anything new, inventory what a household already holds. Employer group life, often one or two times salary and frequently forgotten. Coverage attached to a union or association membership. A policy bought decades ago and left in a drawer. Social Security survivor benefits, which are a real income stream for a surviving spouse and dependent children and which change the size of any gap you are trying to fill. The gap you are insuring is what remains after all of that, not the headline number a needs calculator returns.
State regulators also run a free search tool that commercial comparison sites have no reason to mention. The NAIC Life Insurance Policy Locator lets a beneficiary or an authorized representative search participating insurers for policies belonging to someone who has died. Through August 31, 2025, it had taken more than 1.17 million search requests and produced over 611,000 matches, connecting consumers with $13.18 billion in life insurance and annuity benefits since its launch in November 2016.
Thirteen billion dollars is what unclaimed looks like at scale. Policies get bought and forgotten, beneficiaries never learn one existed, and the money sits. The tool is free, run by regulators rather than a vendor, and searches can take several months to come back. If a parent or spouse died and you have ever wondered whether a policy existed, that is where to start.
The same logic runs forward. A policy nobody knows about is a policy that may never be claimed. Whatever you buy, tell the beneficiary it exists, tell them which company issued it, and put the policy number somewhere they will actually look.
If you have not sized the coverage yet, start with how much and for how long, then come back. If the choice between product types is the open question, term versus permanent covers it. More in the life insurance section.
Three questions that settle it
1. What specific bill arrives if I die, and on what date does that bill stop existing? A mortgage with eleven years left is an eleven-year problem. Support for a child with lifelong needs has no end date at all. Answer this and the product is largely chosen before any quote gets pulled.
2. Am I buying a promise, a savings account, or both, and would I buy that savings account on its own terms? Strip the death benefit out mentally and look at the accumulation piece alone. If the same money in an ordinary account would serve better and the insurance need is genuinely dated, the lease is the honest answer. If the tax treatment and creditor protections are doing real work on a specific estate problem, the purchase may be right.
3. If household income dropped 30 percent, would this premium still get paid in year twelve? This is the question the surrender data is asking. A policy surrendered early can return less than what was paid into it, and one that lapses pays nothing at all. So set the face amount from the premium that still gets paid when income drops, then decide whether that amount is worth buying.
The short checklist
- Write down the dated need. The bill, the amount, and the year it disappears. One line.
- Subtract what already exists: group life, association coverage, old policies, and the survivor benefits a household would receive.
- Run the division on the table above for your own start and end ages, so you know what odds you are buying.
- Get quotes from several carriers on identical coverage, same face amount and same term length, so the comparison is real. Carriers underwrite the same person differently, which is the entire reason shopping works.
- Before signing anything permanent, ask in writing for an in-force or sales illustration showing the guaranteed columns, not just the projected ones.
- Tell the beneficiary the policy exists, and where the paperwork lives.
Questions readers actually ask
Is it too late to buy at 65 or 70?
Coverage is generally still available at those ages, with more underwriting and higher cost. The more useful framing is that the odds shift. A 20-year term bought at 65 runs to 85, and the SSA table shows 45 percent of men and 57 percent of women who reach 65 are still alive then, which is why that policy is priced as a coin flip rather than a long shot.
Should I cash out a policy I already have?
Not before you know what the surrender actually returns and what replacing the coverage would cost at your current age and health. Surrendering is close to irreversible, and the industry’s own filings show large volumes of money leaving these contracts before they ever pay a death benefit. Request the in-force illustration first and read the guaranteed column.
Do I need a medical exam?
Not always. Accelerated underwriting can substitute prescription and claims databases for a physical. Skipping the exam usually means paying more for the same coverage, because the insurer is pricing for what it did not get to see.
Why do quote forms ask for a phone number?
Because on most comparison sites the form is a lead form, and a completed one is sold to one or more licensed agents who then call. That is the business model, and it is legal when properly disclosed. Read the consent language above the submit button and note which companies are named in it before you agree.
Frequently asked questions
What share of 60-year-old men reach 80 on the SSA table?
About 60 percent: 50,865 lives at 80 divided by 84,544 at 60 on the SSA 2023 period life table used in the 2026 Trustees Report. For women the same span is about 71 percent (64,606 ÷ 91,080). A 20-year term bought at 60 ends at 80—so most buyers are still alive when it expires.
When does a 20-year term become more likely than not to pay for men?
Around a purchase at 65 running to 85. The same SSA table gives roughly 45 percent of men and 57 percent of women still alive at 85 among those alive at 65. That is why pricing at those ages feels like a coin flip rather than a long shot—and why “cheap term forever” messaging stops fitting.
How should you think about term versus permanent after 50?
Term is a lease with an end date; permanent is a purchase with ongoing cost-of-insurance or level-premium funding. Buy the lease when the bill has a date (mortgage years left, years until retirement assets take over). Buy the purchase when the need never ends—lifelong dependent support, estate liquidity for a farm or business, or a single-life pension with no survivor option. Related sizing: how much and for how long.
What do NAIC 2025 filings say about money leaving life contracts early?
Surrender benefits and withdrawals totaled $487.6 billion in 2025 across life contracts broadly (including annuity/deposit-type activity). The NAIC average surrenders-to-premiums ratio hit 61.1 percent—highest in the ten years that report charts. Treat that as scale of early exits, not a headcount of life-only cash-outs, and stress-test whether your premium survives year twelve.
Why does whole life dominate operating gain in NAIC results?
Of $36.8 billion in life-line operating gain in 2025, whole life alone was $23.4 billion versus term’s $10.2 billion, on $69.8 billion versus $40.4 billion of net premium. Whole life books also sit on decades of reserves earning investment income; raw gain/premium is a poor “margin” comparison. The distribution lesson is narrower: products that generate the most gain get the most sales push.
What should owners of universal life with secondary guarantees request in writing?
An in-force illustration showing guaranteed columns, not only current/illustrated rates. Universal life with secondary guarantees posted a $1.8 billion operating loss in the 2025 NAIC life-line results—a block under pressure. Cost-of-insurance charges can rise within contract limits. In states adopting the NAIC Life Insurance Illustrations Model Regulation (Model #582), owners may request updates after the first anniversary.
Are life insurance death benefits generally taxable to beneficiaries?
Under Internal Revenue Code section 101(a), amounts paid by reason of the insured’s death are generally excluded from the beneficiary’s gross income. That statutory treatment applies to term as well as permanent—so tax exclusion alone is not a reason to buy permanent coverage.
What inventory should you run before pricing any new policy after 50?
Employer group life, union/association coverage, forgotten personal policies, and Social Security survivor benefits a household would actually receive. The insured gap is what remains. Then run the SSA lives-alive division for your start and end ages so the odds are explicit before you compare carriers on identical face amount and term.
How large is the unclaimed-policy problem the NAIC locator addresses?
Through August 31, 2025 the NAIC Life Insurance Policy Locator had taken more than 1.17 million search requests, produced over 611,000 matches, and connected consumers with $13.18 billion in life and annuity benefits since November 2016. Tell beneficiaries the company and policy number while you are alive.
What is guaranteed-issue / final-expense coverage designed to do?
Small permanent policies sold with little or no underwriting, aimed at burial and end-of-life costs. Face amounts are limited; early-year benefits are often restricted by contract. Read that clause first. It is the right tool when traditional underwriting will not accept you—not when a healthier applicant was never shown better options. Product mechanics: no-exam life insurance.
Why won’t this article quote national average life premiums?
No federal agency publishes a life-insurance premium index the way BLS does for motor vehicle insurance. Marketplace “averages” are usually marketing by commission-paid quote funnels. Identical-coverage quotes from several carriers on your own age and health are better data than any national average.
What three questions settle product choice before any quote call?
What specific bill arrives if you die, and on what date does it stop? Are you buying a promise, a savings account, or both—and would you buy that savings piece alone? If household income dropped 30 percent, would the premium still be paid in year twelve? Answer those and the term-versus-permanent decision is largely made.
How does CDC longevity context relate to buying after 50?
NCHS Data Brief No. 548 reported U.S. life expectancy at birth of 79.0 years in 2024 and 19.7 years remaining at age 65. Longevity averages are not policy odds. Use the SSA lives-alive columns for the exact start and end ages of the term you are considering; averages alone do not price a 20-year lease.
What is the expensive error when permanent is sold as a default after 50?
Buying the purchase version when the need had a clear end date, then discovering in year eight that the payment no longer fits. Permanent earns its price for undated needs and certain estate-liquidity problems—not as a generic upgrade from term. If the need is dated, size the lease and stress-test the premium.

Sources
6
Every figure in this article traces to a government record or to a named independent, non-commercial research body. We do not cite insurance marketplaces or affiliate comparison sites for data.
- Social Security Administration, Office of the Chief Actuary Actuarial Life Table, period life table for 2023 as used in the 2026 Trustees Report Published 2026-05-28Supports: Life expectancy and number of lives at ages 50 through 85; all survival probability calculations in this article
- National Association of Insurance Commissioners U.S. Life and A&H Insurance Industry, 2025 Annual Results Published 2026-01-01Supports: Surrender benefits $487.6B in 2025; surrenders-to-premiums ratio 61.1% vs 58.4% in 2024 and 43.9% in 2016; whole life operating gain $23.4B and term $10.2B of $36.8B line total; whole life net premium $69.8B, term $40.4B; universal life with secondary guarantees $1.8B operating loss; 727 filers
- National Association of Insurance Commissioners NAIC Life Insurance Policy Locator Tool Helps Consumers Connect with More Than $13 Billion in Benefits Published 2025-09-30Supports: 1.17 million search requests, 611,000+ matches, $13.18 billion in benefits located through Aug 31 2025; tool launched November 2016
- Centers for Disease Control and Prevention, National Center for Health Statistics Mortality in the United States, 2024 (NCHS Data Brief No. 548) Published 2026-01-29Supports: Context for rising longevity: life expectancy at birth 79.0 years in 2024; life expectancy at age 65 of 19.7 years
- U.S. Internal Revenue Code 26 U.S.C. 101(a), Certain death benefits Published 2026-01-01Supports: Death benefits paid by reason of the insured death are generally excluded from the beneficiary gross income
- National Association of Insurance Commissioners Insurance Topics: Life Insurance Illustrations (Life Insurance Illustrations Model Regulation, Model #582)Supports: Model #582 defines the in-force illustration and provides that after the first policy anniversary the policy owner may request periodic updates on policy performance; the basic illustration shows guaranteed elements alongside their non-guaranteed counterparts
Figures last verified August 28, 2026.