

The standard answer is a multiple of income. Ten times salary, or twelve, depending on who is asking. It is easy to remember, easy to quote, and it has one structural problem: it produces the same recommendation for a 34-year-old with two toddlers and a 58-year-old whose children finished school six years ago.
Those households face different problems. A rule that gives them the same answer is not really doing math. The answer it produces also tends to run larger than what a household reaches on its own.
The alternative takes about twenty minutes and needs a calendar, a rough number for what your household spends, and one federal table. It produces two answers rather than one: how much, and for how long. The second is the one that gets skipped, and it is the one that decides whether the policy ever pays.
Step one: list the obligations, with dates
Coverage replaces specific money that stops arriving. So write down the specific money, and next to each item write the year it ends.
A typical list runs: remaining mortgage balance and the year it is paid off; other debts that would not die with you; the cost of raising each dependent child through the end of their education, with a year attached; income replacement for a spouse until retirement assets take over, with a year attached; final expenses, which have no year because they are immediate.
Two things fall out of this list immediately. The total is usually different from ten times income, sometimes higher and often lower. And the items have different end dates, which means the coverage does not need to be one block of one size lasting one length of time.
Step two: subtract what already exists
Salespeople rarely bring this step up, because it shrinks the number they are quoting.
Subtract employer group life, which is often one or two times salary and frequently forgotten. Subtract coverage attached to a union or association membership. Subtract policies bought years ago and filed away.
Then subtract Social Security survivor benefits, the line household calculations most often leave out entirely. A surviving spouse, a surviving divorced spouse, an unmarried child, or a dependent parent may qualify for monthly benefits on the deceased worker’s earnings record. The Social Security Administration puts a surviving spouse’s payment at 71.5 percent of the worker’s benefit at the earliest claiming age, rising the longer the claim is deferred: above 75 percent at 61, above 80 percent at 63, above 90 percent at 65, and up to 100 percent at the survivor full retirement age, which falls between 66 and 67. Children generally receive 75 percent. Amounts track the worker’s lifetime earnings, so the figure has to come from your own record at ssa.gov, not from a rule of thumb.
One federal number not to build around: the lump-sum death payment is $255, paid once to a qualifying spouse or child, and survivors have two years from the date of death to claim it. That amount has not moved in decades.
What remains after those subtractions is the gap. That number, not a multiple of salary, is what you are shopping for.
Step three: the length, from the federal table
The longest end date on your list sets the term length. That part is simple. What is worth understanding is what that length means in probability terms, and the Social Security Administration publishes the table that tells you.
Here is how to read it. The “alive per 100,000” figures count how many of an original 100,000 births are still living at that exact age. To find the odds of surviving any span, divide the number at the ending age by the number at the starting age.
| Exact age | Alive per 100,000, men | Alive per 100,000, women |
|---|---|---|
| 50 | 91,126 | 95,269 |
| 55 | 88,436 | 93,577 |
| 60 | 84,544 | 91,080 |
| 65 | 79,084 | 87,399 |
| 70 | 71,916 | 82,374 |
| 75 | 62,797 | 75,248 |
| 80 | 50,785 | 64,606 |
| 85 | 35,529 | 49,469 |
Source: Social Security Administration, period life table for 2023 as used in the 2026 Trustees Report.
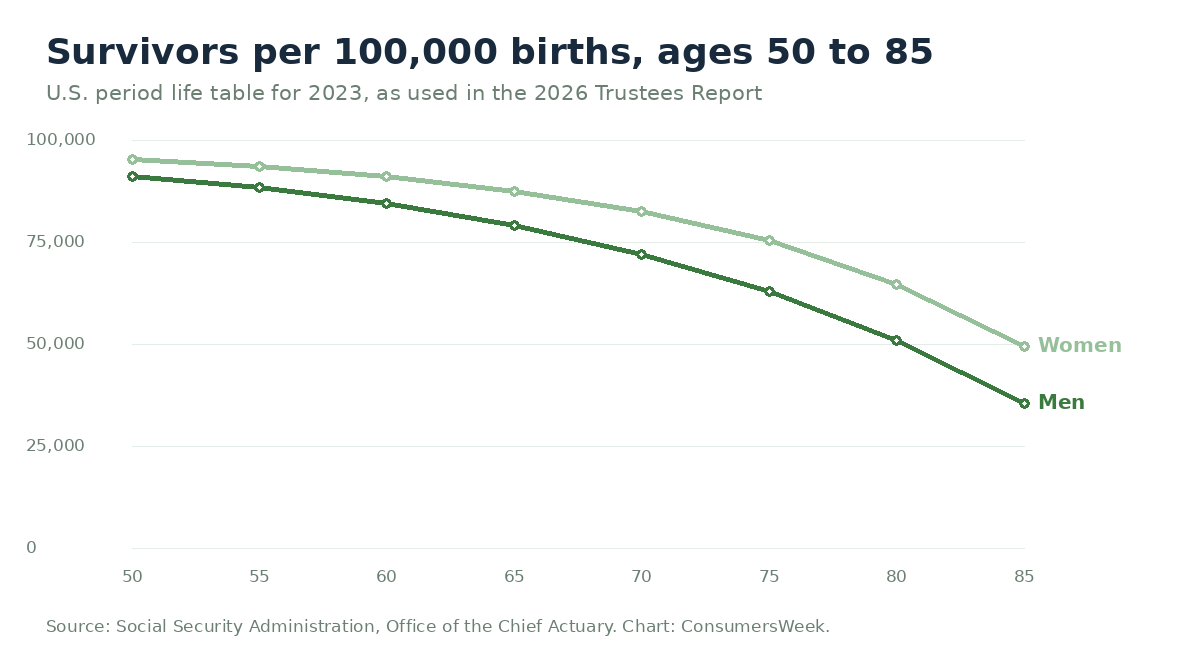
Plotted, the table shows where the drop-off actually starts. Between 50 and 65 the male line falls by about 12,000 per 100,000. Between 70 and 85 it falls by about 36,000. That bend is the reason a term ending at 85 prices so differently from one ending at 70.
A 20-year term bought at 50 runs to 70. Divide 71,916 by 91,126 and about 79 percent of men are still alive at the end of it; 82,374 divided by 95,269 gives about 86 percent for women. Bought at 55 and running to 75, the figures are about 71 percent and 80 percent. Bought at 65 and running to 85, about 45 percent and 57 percent.
Those numbers should reassure you. A term policy that expires unused is the outcome you were hoping for. The numbers exist to tell you what you are actually buying, which is protection against the less likely outcome, priced to match.
They also explain why term length drives price so sharply. A policy ending at 70 covers a span most people survive. One ending at 85 covers a span many do not, and the premium follows the table.
Where the multiple-of-income rule came from
Rules of thumb survive because itemizing takes twenty minutes and quoting a multiple takes four seconds. For decades the multiple was the only thing deliverable over a kitchen table without a spreadsheet.
To be fair, a multiple is fast, roughly right for the household in the middle of the distribution, and something imperfect beats coverage that never gets bought while a family waits to do the exercise properly. I have watched families put this off for three years while they waited to do it properly.
What it cannot do is tell you when to stop. A multiple has no end date built into it, so it never says the coverage should shrink, and it never says the term should end. Those are the two answers that save a household the most money over thirty years, and they only come from the list.
Why one policy is often the wrong answer
If the mortgage ends in fourteen years and the youngest child finishes school in nine, those are two different problems, even if they feel like one.
Buying a single large policy for the longest term means paying for the child-raising portion of the coverage for years after it stopped being needed. Layering, sometimes called laddering, sizes each piece to its own end date: a shorter, larger policy for the years when everything overlaps, and a longer, smaller one for the obligation that runs latest.
The downside is that two policies mean two sets of paperwork, two renewal dates, and two chances to let something lapse by accident. For some households the simpler single policy is worth its inefficiency. Just make that choice on purpose.
The limit nobody mentions
There is a coverage amount above which a household stops paying the premium, and it is usually reached before anyone notices.
Regulator data backs this up. In 2025, $487.6 billion was surrendered or withdrawn from life contracts, a ten-year high relative to premiums, according to the NAIC. That total includes annuities, so it is not a count of people dropping life coverage, but it shows how often money leaves these contracts before a death benefit is ever paid.
So the sizing exercise has a second constraint alongside the gap. Whatever the arithmetic says you need, the premium has to be one the household can carry through a bad year. Coverage that lasts at a smaller face amount beats coverage that looks right on paper and gets canceled in year nine.
Related: term versus permanent, and buying after 50. All in the life insurance section.
The twenty-minute version
- List each obligation with its amount and the year it ends. Mark permanent needs “never”.
- Subtract group life, association coverage, existing policies, and survivor benefits.
- Set the term length from the latest end date on the list.
- Run the division on the table above for your start and end ages, so the odds are explicit, not assumed.
- Ask whether the premium survives a bad year. If not, reduce the face amount instead of the term.
- Confirm no old policy is already sitting unclaimed. The NAIC Life Insurance Policy Locator is free and had connected consumers with $13.18 billion in benefits through August 31, 2025.
Where this gets argued
Is ten times income ever right?
Sometimes, by coincidence. For a household in peak earning years with a mortgage and young children, the itemized total often lands near that range, which is why the rule survives. The problem is that it stays fixed while the underlying obligations shrink every year. The list works better because it changes when your life does.
Should I insure a spouse who does not earn income?
The question is what would have to be purchased if that person were gone. Childcare, household management, and eldercare are real costs that would need paying from somewhere. Size that, put a year on it, and it becomes an ordinary line on the list instead of a separate debate.
What about final expenses?
It belongs on the list with no end date, since it is immediate. For amounts in that range, price a small policy against simply holding the money in savings. Savings clear no underwriting and cannot lapse, though they only cover what has accumulated, while a policy pays its face amount from the moment it is in force.

Sources
5
Every figure in this article traces to a government record or to a named independent, non-commercial research body. We do not cite insurance marketplaces or affiliate comparison sites for data.
- Social Security Administration, Office of the Chief Actuary Actuarial Life Table, period life table for 2023 as used in the 2026 Trustees Report Published 2026-05-28Supports: Number of lives per 100,000 at exact ages 50, 55, 60, 65, 70, 75, 80 and 85; every survival probability in this article and the survivorship chart
- National Association of Insurance Commissioners U.S. Life and A&H Insurance Industry, 2025 Annual Results Published 2026-01-01Supports: Surrender benefits $487.6B in 2025 and average surrenders-to-premiums ratio of 61.1%, the highest in the ten years reported
- National Association of Insurance Commissioners NAIC Life Insurance Policy Locator Tool Helps Consumers Connect with More Than $13 Billion in Benefits Published 2025-09-30Supports: $13.18 billion in benefits connected to consumers through Aug 31 2025
- Social Security Administration Survivor benefits: what you could getSupports: Surviving spouse benefit of 71.5% of the worker benefit at the earliest claiming age, rising above 75% at 61, above 80% at 63, above 90% at 65 and up to 100% at survivor full retirement age of 66 to 67; children generally 75%; one-time lump-sum death payment of $255
- Social Security Administration Who is eligible to receive Social Security survivors benefits and how do I apply?Supports: Eligible survivors include a surviving spouse, surviving divorced spouse, unmarried child or dependent parent; survivors must apply for the $255 lump-sum death payment within two years of the date of death
Figures last verified August 28, 2026.