

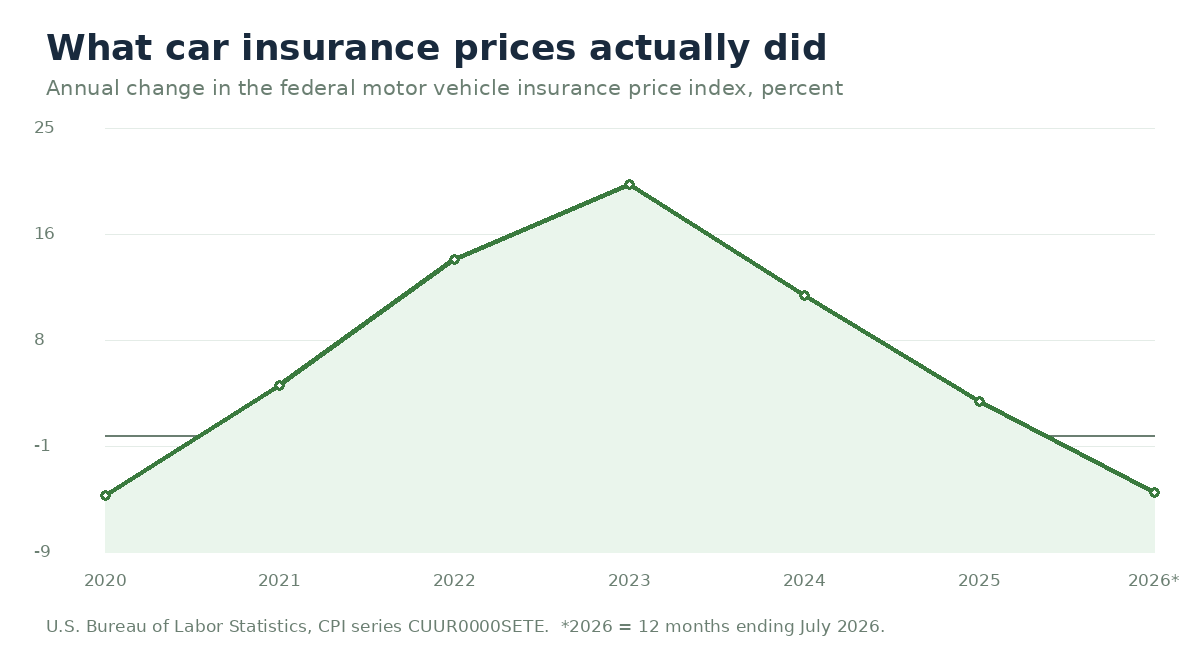
Car insurance prices are falling. The federal motor vehicle insurance index dropped 4.5% in the twelve months ending July 2026, its fifth straight monthly decline. Your renewal notice may still have gone up, and almost nobody explains how both can be true. The reason your bill still feels brutal is that prices rose 17.4% in 2023 and another 17.8% in 2024, a 38.2% jump in two years. Rates are now easing off a plateau you are still standing on. A spotless driving record protected you from less of that than you would expect. I worked on the industry side of insurance marketing for years, and the reason is simple: you are not priced as an individual. You are priced as part of a pool, and the pool got expensive.
You share the bill with strangers
Everyone in your rating pool shares its costs. You can drive carefully for years, but if repair bills, medical costs and legal settlements across the pool climb, your share climbs with them. Your premium went up because the pool’s costs went up, not because of anything you did.
Renewal letters never put it that way, but that is how the pricing works. Insurers project what the entire pool of drivers in your state will cost them next year, file those projections with your state’s insurance regulator, and receive approval to raise base rates across that pool. Your clean-driver discount still applies. It just applies to a bigger number.
What actually made the pool expensive
Four costs did most of the damage, and none of them care about your driving record.
Repair costs. A bumper used to be a piece of painted plastic. On most cars built after 2020, it is a housing for radar sensors and cameras that must be recalibrated after even a minor tap. This is the one cost that has not turned around. While insurance prices fell over the past year, the federal index for motor vehicle maintenance and repair rose 6.6% in the twelve months ending July 2026. Every one of those repairs comes out of the pool you belong to, which is why repair inflation can reach your premium even when you never file a claim.
Vehicle values. When a car is totaled, the pool buys a replacement at today’s prices. This one is a lagging cost. Over the twelve months ending July 2026, new vehicle prices rose just 0.5% and used vehicle prices fell 1.9%. The damage was done earlier. The elevated values locked in during the 2021 to 2023 run-up are still sitting in the replacement cost of the cars on the road right now.
Medical and legal costs. Injury claims are paid at medical prices, and those are still climbing. Medical care services rose 2.7% over the twelve months ending July 2026, with hospital services up 5.2%, well ahead of the 2.5% core inflation rate over the same period. Litigated claims may settle considerably higher still. Every settlement is paid out of the pool.
Weather. Hail and flood losses hit the comprehensive side of your policy. If you live in a storm-prone state, part of your increase is the pool pre-paying for the next season.
What did not cause it
The renewal letter invites some wrong guesses, so let me clear them up. It was not that claim you filed four years ago; surcharges from an old claim typically age off after three to five years, not on. It was not your age ticking up a year; for most adult drivers, each birthday is neutral to slightly favorable. And it was not a secret file with your name on it. Rate increases are filed with your state against the whole pool, months in advance, by actuaries who have never heard of you. In a way that is good news. Nothing about you broke, and you do not need to fix anything about yourself to shop for a better price.
The renewal math nobody shows you
Here is a simplified look at what typically happens inside a renewal. The figures are round, made-up numbers to show the mechanism, not market averages. Run the same structure against your own policy documents to see your version of it.
| Line item | Two years ago | This renewal |
|---|---|---|
| State base rate (the pool’s share) | $2,000 | $2,700 |
| Your clean-record discount | -20% | -20% |
| Your premium | $1,600 | $2,160 |
Neither your discount nor your driving changed. The base rate moved, so your bill moved. This is why calling your insurer to ask “what did I do wrong” gets you a polite nothing: you did nothing wrong, and the representative has no lever to pull, because the increase was filed with your state months before your letter printed.
Why your loyalty is quietly expensive
I watched this part from the inside for a long time. Carriers spend enormous money acquiring new customers, and the sharpest prices go to people actively shopping. Existing customers get the filed increases without the courtship. The industry calls the gap between what shoppers pay and what renewers pay by various polite names. You would call it a loyalty tax.
The practical consequence: a clean record is worth the most on the open market, not at renewal. Carriers price the same driver very differently, because each one runs its own model against its own pool. Several state insurance departments publish official premium comparison tools showing the spread across carriers for identical coverage, and the range is routinely wide enough to matter. The driver and the coverage are identical. The price is not.
Your state did a lot of the deciding
National averages hide how uneven this repricing has been, because insurance is regulated and priced state by state. A national index falling 4.5% is an average of markets moving in opposite directions. Some states are still absorbing increases their regulator approved a year ago, while others have started handing money back. Averaging them produces a number that describes no actual driver. Your state’s department of insurance publishes the rate filings carriers submitted for your market, and that is the only place the real number for where you live exists.
Why the spread? Each state has its own minimum coverage laws, its own fault system, its own uninsured-driver rate, its own weather losses, and its own regulator approving or pushing back on filings. A clean-record driver in Hartford and one in Boise belong to completely different pools with completely different costs. The advice here is national, but the numbers on your renewal are local, so start with your own state’s rules before you shop.
The free comparison tool many states publish
Before paying a comparison site to shop for you, check whether your own state already does it for free. Many state insurance departments publish official premium comparison tools built from the rates carriers filed with that department. California, Texas, and New York are among the states that run one. They show sample premiums by carrier for standardized driver profiles in your area.
These tools are not glamorous and they will not quote your exact policy. What they do is show the spread. Seeing that carriers filed materially different rates for the same profile in the same ZIP code tells you whether shopping is worth your afternoon, before you hand your phone number to anyone.
You have never seen one advertised because nobody earns a commission when you use them. Every comparison site you have seen an ad for is compensated when you submit your information, which is a fine business model and also a reason to start somewhere that has no stake in the outcome. Search your state insurance department plus the phrase premium comparison, and start there. Our car insurance guide covers the rest of how coverage is priced.
The cost the renewal letter leaves out
There is a second comparison that explains the squeeze better than any premium figure. Between 2020 and 2024, the federal motor vehicle insurance index and US median household income both climbed, but not at the same speed. The American Academy of Actuaries, the profession’s standards body, put the cumulative gap at 36.1 percentage points over those four years. Income grew, the bill grew faster, and you feel the difference.
The burden also varies enormously by state, for the reasons above, so the same legal requirement eats a very different share of a household budget depending on where you live.
The federal spending survey adds a sharper comparison. In 2024, households earning $30,000 to $40,000 spent an average of $1,595 a year on vehicle insurance. Households earning $150,000 to $200,000 spent $2,643. The higher-income household pays about 66% more in dollars while earning roughly five times as much.
Run it as a share of income using the midpoint of each band and the picture inverts. Roughly $1,595 against $35,000 is about 4.6% of pre-tax income. Roughly $2,643 against $175,000 is about 1.5%. The lower-income household carries about three times the burden for the same legal obligation to drive to work. You can check that in ten seconds with a calculator.
Nobody designed it that way on purpose. It falls out of the arithmetic. State minimum liability limits are the same for every driver regardless of income. The pool does not means-test. And several of the factors carriers rate on, including credit-based insurance scores and garaging territory, happen to correlate with income, so the pricing follows income without ever asking about it.
The industry’s defense goes like this. Carriers price expected loss rather than income, and they must justify every factor to a state regulator before using it. Credit-based insurance scores have repeatedly been found predictive of claim frequency, which is the actuarial test that matters. A pricing factor that correlates with income is not automatically a factor that charges for being poor, and a carrier that ignored predictive data would end up overcharging its safest customers to subsidize its riskiest. That argument is coherent and it is why regulators have largely allowed the practice.
My objection is narrower than people expect. The factors do predict claims. A system can still be actuarially sound and produce an outcome where the households least able to absorb a $200 increase are the ones most exposed to it, for a product they are legally required to buy. The renewal letter mentions neither point.
The practical takeaway is that credit is a pricing lever with nothing to do with driving, and it is not universal. California prohibits credit-based insurance scoring for personal auto outright under 10 CCR section 2632.5(c)(2), a rule tracing back to Proposition 103 in 1988, which restricts auto rating primarily to driving record, annual mileage, and years of experience. A small number of other states ban or limit the practice, and the details differ enough state to state that secondary summaries routinely contradict each other on the count. Your state insurance department is the authority on your own market, and the check takes about five minutes.
What a safe driver can actually do
You cannot vote yourself out of the pool, but you can control which pool you are in and how much of its risk you carry personally.
- Shop every renewal, minimum three quotes. Switching is not always right, but a competing quote is the only reliable price signal you get. Twenty minutes, twice a year for six-month policies.
- Reprice your deductible. Raising your deductible lowers the pool’s exposure on every claim you file, and that lower exposure shows up in your premium. The size of the reduction varies by carrier and state, so ask for the actual quoted difference instead of trusting a rule of thumb. Only do this if the extra $500 would not wreck your month.
- Run the 10x test on older cars. If your vehicle is worth less than roughly ten times the annual cost of collision and comprehensive, you are overpaying to insure it. Consider dropping those coverages and banking the difference.
- Check your credit report. In most states, credit-based insurance scores are a top-three pricing factor. An error on your report is an error on your premium.
- Protect the record itself. The clean record still matters enormously. Every state’s approved rate filings include surcharge schedules for tickets and at-fault accidents, and those surcharges may follow you for several years. The discount did not shrink. What changed is the size of the bill it gets applied to.
Before your next renewal, ask three things
If you only keep one section, keep this one.
- When did I last get a competing quote? If the answer is more than a year ago, you are paying the renewer’s price, not the shopper’s price.
- Does my deductible match my emergency fund? Carry the highest deductible you could actually cover tomorrow.
- Is my coverage matched to my assets? Liability limits protect what you own. The cheapest quote with thin limits is not cheap if you have a house and a lawsuit.
What readers ask most
Will rates come back down?
They already are, nationally. The federal motor vehicle insurance index has fallen for five consecutive months and is down 4.5% year over year as of July 2026. Whether that reaches your renewal depends on your state and your carrier, because filed rates come down when the pool’s costs come down, and repair complexity is not getting cheaper.
Does a clean record still matter?
Yes. It does not exempt you from pool-wide increases, but tickets and at-fault accidents add surcharges on top of them, often for several years.
Should I just switch to whoever is cheapest?
Usually the cheapest reputable quote at your coverage level is the right call. Sometimes it is not: check the carrier’s claims satisfaction and keep your liability limits matched to your assets before you chase the last $8 a month.
Why did my online quote change after I entered my phone number?
Because the first number you saw was a teaser estimate built from partial data, and the real quote arrived once the carrier could actually rate you. I spent years on the marketing side of exactly these funnels. Keep quoting, but compare final quotes rather than teaser screens, and expect follow-up calls once you enter your information unless the site says otherwise. Read the consent language before you hit submit.
Would a tracking program lower my rate?
Sometimes meaningfully, sometimes it raises it. Telematics programs reward low-mileage, daytime, smooth-braking drivers and can penalize the opposite, and the details vary a lot by carrier. That decision deserves its own article: see our breakdown of who actually saves with usage-based insurance and who quietly pays more.
Your own premium depends on your state, carrier, vehicle, and profile. National figures describe the market, not your renewal.

Sources
6
Every figure in this article traces to a government record or to a named independent, non-commercial research body. We do not cite insurance marketplaces or affiliate comparison sites for data.
- U.S. Bureau of Labor Statistics Consumer Price Index, July 2026 Published 2026-08-12Supports: Motor vehicle insurance index -4.5% YoY; five consecutive monthly declines; motor vehicle maintenance and repair +6.6% YoY
- U.S. Bureau of Labor Statistics Consumer expenditures in 2024 Published 2025-12-19Supports: Vehicle insurance prices +17.4% (2023), +17.8% (2024), +38.2% two-year total
- U.S. Bureau of Labor Statistics Consumer Expenditure Surveys, vehicle insurance expenditure by income before taxes (2024) Published 2025-12-19Supports: $1,595 (income $30-40K) and $2,643 (income $150-200K) average annual household vehicle insurance spend; share-of-income math is our own calculation from band midpoints
- California Code of Regulations / California Department of Insurance 10 CCR 2632.5(c)(2), auto rating factor regulations under Proposition 103Supports: California prohibits credit-based insurance scoring as a personal auto rating factor; Prop 103 rating factor hierarchy
- U.S. Bureau of Labor Statistics CPI series CUUR0000SETE, motor vehicle insurance, US city average, not seasonally adjustedSupports: Annual percent change in the motor vehicle insurance index 2020 through 2025, as compiled by the American Academy of Actuaries (CAS Spring Meeting, May 2026) from this series
- American Academy of Actuaries Cost Drivers and Affordability in Personal Automobile Insurance, CAS Spring Meeting Published 2026-05Supports: Auto insurance costs outpaced US median household income by a cumulative 36.1 percentage points from 2020 to 2024, compiled from BLS CUUR0000SETE and FRED median household income. Professional standards body, non-commercial
Figures last verified August 26, 2026.