

Cash back cards are now the most common general purpose credit card in the country. The CFPB’s December 2025 report to Congress puts their share of general purpose accounts at 36 percent, up from 28 percent ten years earlier, while cards carrying no rewards at all declined substantially over the same period. In that same market, consumers were assessed $160 billion in interest during 2024, up from $105 billion in 2022, plus $31.3 billion in fees.
Those two facts are the same fact viewed from opposite ends. Understanding the connection is what decides whether a rewards card is worth carrying, and it is the part that gets left out of every list of ten cards.
Where the money for rewards comes from
Two revenue lines fund a rewards program. Interchange is paid by merchants on every transaction. Interest and fees are paid by cardholders. In its analysis of issuer economics the CFPB groups interchange and rewards expense together, on the reasoning that issuers typically use interchange revenue to cover the cost of both.
The everyday version of this is the free refill. A restaurant that pours a second coffee at no charge is not losing money on it. The refill is priced into the menu, and the customer who takes one subsidizes the customer who takes four. Nobody is being cheated and nothing is hidden. The only question that matters is which side of the average you are sitting on.
In 2024, 43 percent of cardholders repaid their balances in full every month, and the share of accounts revolving a balance sat at around 50 percent, back to its pre-pandemic level. So the population splits roughly in half, and the two halves have very different experiences of the same product.
The split that market averages hide
Rewards accrue on spending. Interest and fees accrue on carried balances. Once the CFPB breaks its 2024 figures down by credit score tier, those two flows are visibly running in opposite directions across the same population.
| Measure, 2024 | Deep subprime | Superprime |
|---|---|---|
| Total cost of credit, revolving general purpose accounts, as a share of balances | 36 percent | 13 percent |
| Same measure on private label cards | 45 percent | 10 percent |
| Average annual purchase volume per general purpose account | About $1,100 | About $13,200 |
| Average late fees incurred per year, general purpose | 3.7 | 0.2 |
The late fee concentration is the sharpest version of it. Cardholders with deep subprime scores held about 14 percent of card accounts in 2024 and generated 40 percent of every late fee charged. Cardholders with superprime and prime plus scores held 59 percent of accounts and paid 7.8 percent of late fees.
Spending runs the other way. Cardholders with superprime and prime plus scores accounted for 85 percent of all credit card purchase volume in 2024, up from 81 percent in 2019. Since rewards are earned on purchases, that is also roughly the share of rewards being paid out. Both halves of the arrangement are legal, disclosed, and entirely ordinary. They just need to be seen together before deciding how much a rewards rate is worth to any particular household.
The arithmetic that settles it in about a minute
Round illustrative numbers chosen to show the mechanism, not market averages. Take $2,000 a month of card spending on a card paying a flat 2 percent. That earns $480 over a year.
Now carry a $2,000 balance. The average APR on general purpose cards was 25.2 percent in 2024, so one month of carrying it costs roughly $42, about a month’s worth of the rewards. Carrying it for the full year costs around $500, which is more than the entire year of earnings at that rate.
That is the entire calculation. A rewards rate of 2 percent competes against an interest rate of 25 percent, and 25 wins every time it is in play. Any comparison of earn rates is a conversation for people in the 43 percent who cleared the statement balance every month. For everyone else the earn rate is a rounding error against the APR, so compare cards on the cost of credit, not rewards.
The annual fee test, done on last year’s spending
About 16 percent of general purpose accounts carried an annual fee in 2024. The average fee was $127, up 21 percent from $105 in 2022, and the CFPB attributes that rise to premium products sold on lounge access, hotel status, and monthly service credits rather than to any broad increase.
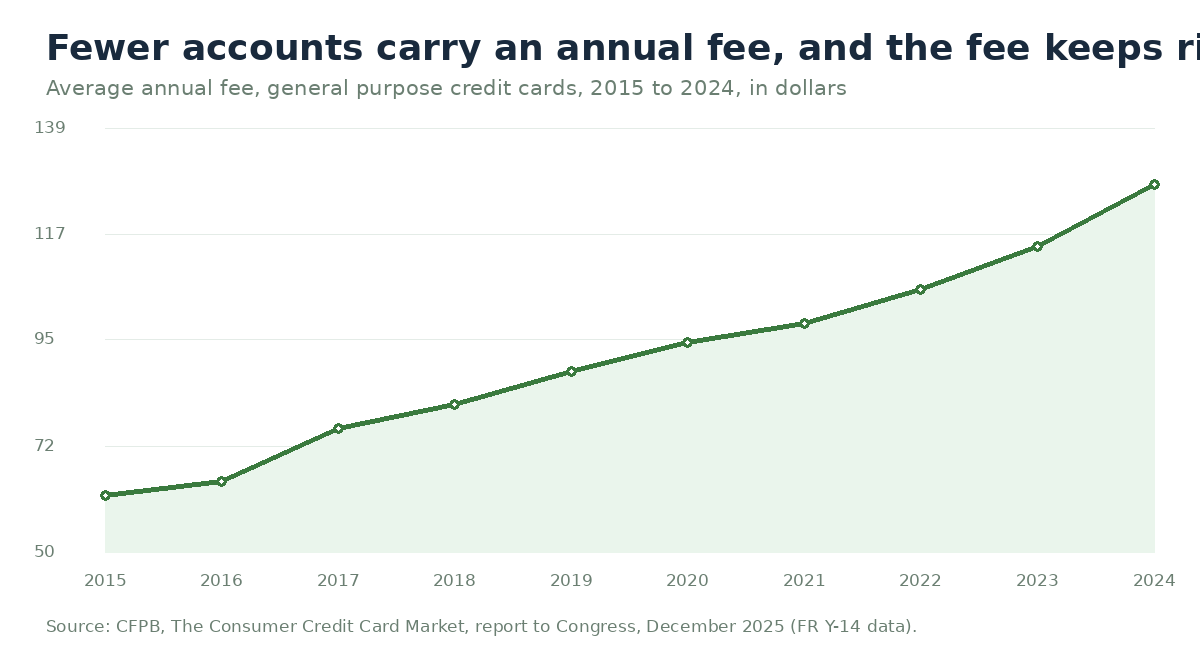
The break-even is one division. Take the fee, divide it by the difference between the card’s earn rate and the rate on a no-fee alternative, and the result is the annual spend required in that category before the fee is repaid. A $95 fee on a card earning 3 percent where the free alternative earns 1.5 percent needs about $6,333 a year of qualifying spend to break even. Illustrative numbers again, but the method holds with real ones substituted.
Run that on last year’s actual statements, not on an estimate. Statement credits count toward the fee only if they get used, and a credit for a service somebody does not already buy is not worth its face value to them. This is where premium cards are typically won or lost, and the CFPB expects fee levels on those products to keep rising.
What a welcome bonus usually arrives attached to
Sign-up bonuses rarely travel alone. Of card offers carrying an introductory promotional interest rate in 2023 and 2024, 61.5 percent also included a rewards-based welcome bonus, against 20 percent of offers without a promotional rate. Ninety-five percent of cards with a promotional introductory rate had no annual fee. The bonus, the zero percent window and the absent fee are sold as one package.
Read what follows that package closely. Three months after opening, average balances on cards with introductory promotions were nearly four times those on cards without one. Thirty-six months after opening, well past the end of any promotion, they were still 69 percent higher. And 79 percent of accounts whose introductory promotions expired during 2024 still carried a balance when the promotion ended.
The CFPB is careful to say that cardholders who choose promotional cards may already borrow differently from those who do not, so the association is not proof that the offer caused the balance. Read it as a warning about who these offers select for. A bonus earned by hitting a spending threshold on a card designed to hold a balance is a bonus with conditions attached further down the page.
Three questions, in this order
- Did you clear the statement balance in all twelve of the last twelve months? Not most months. All of them. A no here settles the question before category earn rates are relevant at all.
- Where does the spending actually concentrate? Across both credit score groups the CFPB tracks, restaurants and non-apparel retail are the two categories used most often, averaging $34 and $81 per transaction in 2024. Airlines and hotels averaged $329 and $361 per transaction but made up roughly 1 percent of transactions. A card built around travel categories earns on about one transaction in a hundred for a typical household.
- Does the fee clear on last year’s real numbers? Run the division above against actual statements. Projected spending is how annual fees get justified in advance and regretted in arrears.
Why there is no list of ten cards here
I spent eighteen years in consumer marketing and lead generation, long enough to know how a ranked card list gets built. The order is a commercial output. Sites are compensated per approved application, payouts differ by card, and the ranking reflects that difference whether or not anyone intends it to.
ConsumersWeek does not rank issuers or run compare-cards modules. Beyond the commercial problem there is a practical one: the answer depends entirely on the three questions above, and any list written before those answers is sorted on something other than the reader’s interest. Offer terms also move faster than articles do.
For an unbiased place to compare live terms, the CFPB runs the Terms of Credit Card Plans survey, a twice-yearly collection of rates and fees from at least 150 issuers, published as raw data with nobody paid for placement. It is dull and it is accurate, which is the correct trade for this decision.
What to do this week
Pull twelve months of statements on the card already in use. Add up the interest and fees actually charged, then add up the rewards actually redeemed, not the rewards accrued. Unredeemed points are the issuer’s liability and not yet anyone’s money.
If the first figure is larger than the second, look for a lower rate, not a better earn rate, and a balance transfer or a fixed-term loan is the comparison to run. If the second figure is larger and the balance clears every month, then the earn structure is worth tuning. Switching to a better-matched card usually gains a few hundred dollars a year, well short of the figures in card marketing.
Either way the diagnostic comes before the product. Anyone still opening a first card should ignore rewards entirely for the first year, because the reporting behavior on that account is worth more than any cash back rate available to a thin file.

Sources
2
Every figure in this article traces to a government record or to a named independent, non-commercial research body. We do not cite affiliate comparison sites for data.
- Consumer Financial Protection Bureau The Consumer Credit Card Market: Report to Congress, 2025 Published 2025-12-30Supports: Cash back share of general purpose accounts 28 to 36 percent over ten years and cards with no rewards declining substantially; $160 billion interest assessed in 2024 against $105 billion in 2022, plus $31.3 billion in fees; 43 percent of cardholders repaid in full each month in 2024 and about 50 percent of accounts revolved; total cost of credit on revolving accounts in 2024 36 percent deep subprime and 13 percent superprime on general purpose, 45 percent and 10 percent on private label; average annual purchase volume per general purpose account about $1,100 deep subprime and $13,200 superprime; average late fee incidence 3.7 per year deep subprime and 0.2 superprime on general purpose; deep subprime held about 14 percent of accounts and generated 40 percent of late fees while superprime and prime plus held 59 percent and paid 7.8 percent; superprime and prime plus accounted for 85 percent of 2024 spending against 81 percent in 2019; average general purpose APR 25.2 percent in 2024; 16 percent of accounts carried an annual fee, average $127 in 2024 against $105 in 2022, series from $62 in 2015; 61.5 percent of offers with introductory promotional rates also carried a rewards welcome bonus against 20 percent of offers without, and 95 percent of promotional-rate cards had no annual fee; balances on promotional cards nearly four times higher at three months and 69 percent higher at 36 months; 79 percent of accounts whose promotions expired in 2024 retained a balance; restaurants and non-apparel retail the most frequent merchant categories at $34 and $81 average transaction, airlines and hotels $329 and $361 at roughly 1 percent of transactions; Terms of Credit Card Plans survey collects rates and fees from at least 150 issuers.
- Consumer Financial Protection Bureau The Consumer Credit Card Market: Report to Congress, 2023 Published 2023-10-25Supports: Interchange and rewards expense are analysed together because issuers typically use interchange revenue to cover the cost of both interchange expense and rewards expense.
Figures last verified August 29, 2026.